JavaScript Express Status Monitor
My Node.js server was eating memory and I didn't know why. No monitoring, no dashboards, no visibility into what was happening at the process level.
13 Oct 2023
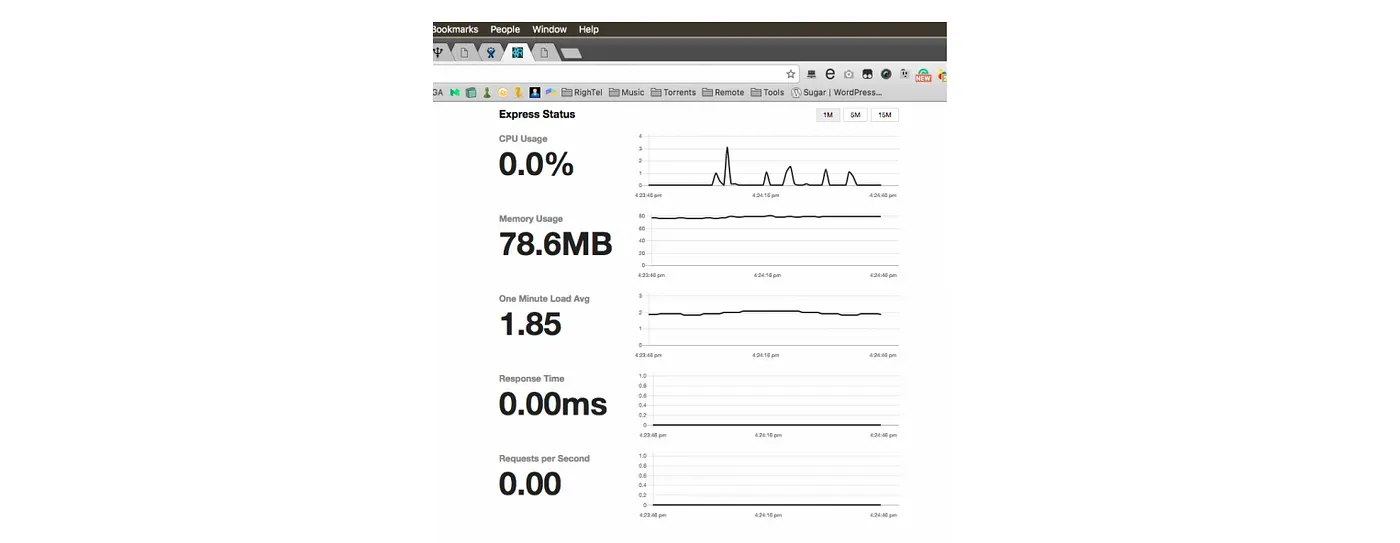
My Node.js server was eating memory and I didn't know why. No monitoring, no dashboards, no visibility into what was happening at the process level.
Then I found express-status-monitor. One line of middleware and you get a real-time dashboard showing CPU usage, memory consumption, response times, and request counts.
Setup
npm install express-status-monitor --saveAdd it as the first middleware in your Express app — before any other middleware or routers:
app.use(require('express-status-monitor')());Visit /status in your browser. That's it. You have a live dashboard.
What it shows you
- CPU and memory usage over time
- Response time distribution
- Requests per second
- Active connections
The trade-off
This is great for development and staging. You get instant visibility with zero configuration.
For production, it's not enough. There's no alerting, no persistence, no multi-instance aggregation. You'll want something like Prometheus + Grafana, Datadog, or New Relic for production monitoring.
But as a quick "is my server healthy?" tool during development, it's hard to beat for the effort required.
AI Transformation for Organisational Leaders
For directors, heads of function and founders: eight live evening sessions with Ehsan Gazar and Anoosh Zeighami, ending with a one-page 2027 AI plan for your organisation, built on a real workflow and ready for your leadership team.
$1,495, or $1,045 with code EARLYBIRD until 23 Oct.
View the live cohortKeep reading
- TypeScript Anti-Patterns That Cost You Twice: Build Time, Runtime, and the Interview
- The Frontend Toolchain Is Now Written in Rust and Go. What That Means for You
- oxlint vs ESLint: Why I Replaced ESLint with oxlint
- SystemJS Is Dead. Native ESM Finally Won.
- Replace Axios with a Simple Custom Fetch Wrapper (Production-Ready Guide)
- Stop Shipping ChatGPT Wrappers. Ship an Agent in TypeScript, or Don't Bother.